

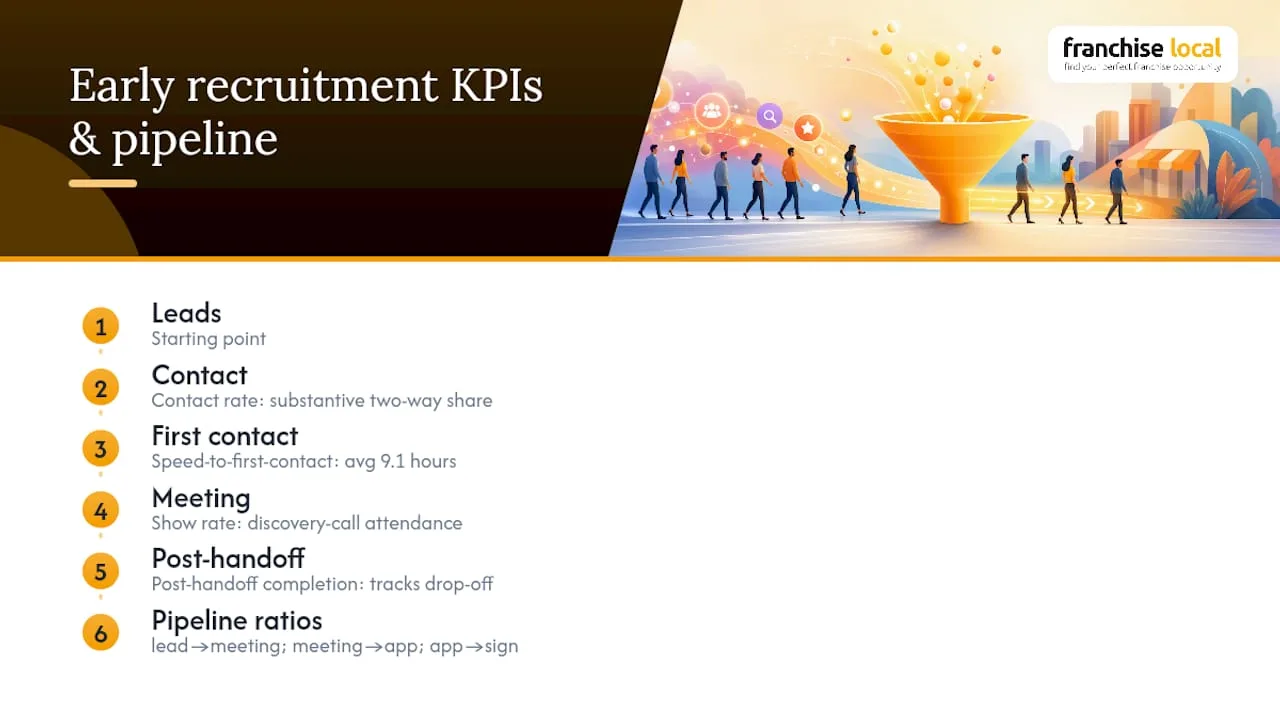
Four metrics predict franchise recruitment success better than any other combination: contact rate, speed-to-first-contact, show rate, and post-handoff completion. Volume metrics like raw lead count tell you almost nothing about who signs. Fix speed-to-first-contact and contact rate first. Everything else in your pipeline improves once those two are under control, and the benchmarks below show exactly what “under control” looks like.
Which franchise recruitment KPIs actually matter?
Most franchisors still measure recruitment by counting leads. That number feels reassuring and predicts almost nothing. The metrics that actually forecast signings sit earlier in the funnel, before a candidate has filled in an application or spoken to a broker.
Contact rate measures the share of leads you reach for a genuine two-way conversation, not just an outbound call logged in the CRM. Treating a voicemail as “contacted” inflates the number and hides a real problem: dead leads that were never properly engaged, as Franchise Performance Group points out when it defines contact as substantive conversation, not attempted outreach.
Speed-to-first-contact is the strongest single predictor in the whole funnel. A study of over 530 franchise brands found that among brands that responded at all, the average email reply took 9.1 hours. Candidates researching multiple opportunities simply move on.
Show rate for scheduled discovery calls or meetings tells you whether your qualification process actually works, or whether you’re booking calls with people who never intended to commit.
Post-handoff completion tracks what happens once a candidate moves from marketing to development, or from development to franchisor. Drop-off here often signals a broken stage transition, not a bad candidate.
Layer in cost per lead, cost per sale, and pipeline conversion ratios (lead to meeting, meeting to application, application to signing) to connect these engagement metrics to your budget.
How do you calculate each recruitment KPI?
Precise formulas matter more than most franchisors realise, because sloppy definitions produce numbers nobody trusts; see this lista de métricas de selección for practical guidance on candidate selection metrics.
- Contact rate = (leads reached for a substantive two-way conversation ÷ total leads) × 100. Exclude voicemails and unanswered calls from the numerator.
- Speed-to-first-contact = timestamp of first substantive contact minus timestamp of lead creation. Report both the median and the 90th percentile, since FranFunnel’s research notes the median shows the typical candidate experience while the 90th percentile exposes worst-case breaches an average would hide.
- Show rate = (candidates who attended a scheduled call ÷ candidates who scheduled a call) × 100.
- Post-handoff completion = (candidates completing the next required stage ÷ candidates handed off to that stage) × 100.
- Lead-to-sign conversion = (signed franchisees ÷ total qualified leads) × 100, measured over a rolling 12-month window to smooth seasonal noise.
Your CRM needs four clean timestamp fields at minimum: lead creation, first contact, meeting scheduled, and stage change. Flag weekend and after-hours leads separately, since response clocks behave differently outside office hours, and deduplicate by phone and email before running any percentage.
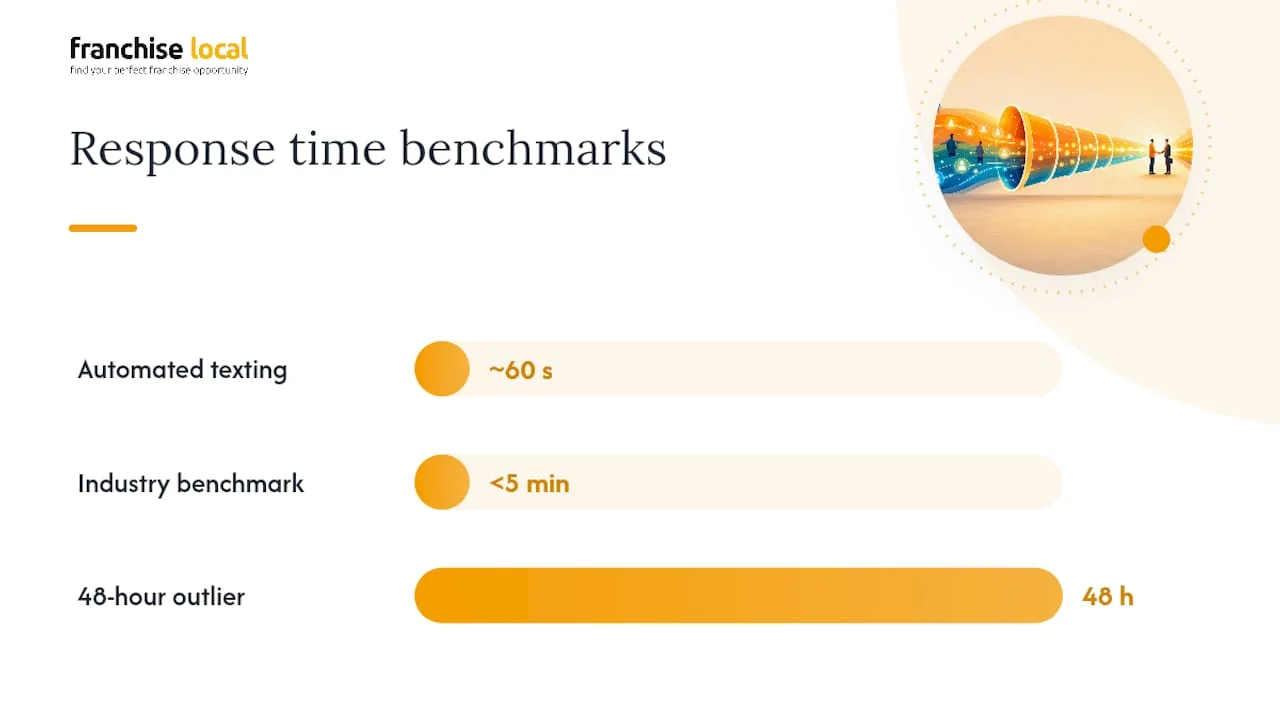
Response speed under 5 minutes is the recognised industry benchmark, with some automated texting workflows achieving replies under 60 seconds, according to FranFunnel’s data.
Build dashboards around medians, not means. One 48 hour outlier can drag a mean response time far past what your team actually delivers on a normal day, and that single distorted figure can trigger the wrong staffing decision.
What are realistic benchmarks for franchise recruitment KPIs?
Benchmarks vary by vertical, investment level, and how mature your recruitment process already is. Still, some numbers hold up as reasonable targets across most franchise categories:
- Contact rate: aim for 70% or higher, reached through genuine conversations rather than logged attempts.
- Speed-to-first-contact: under 5 minutes, the industry best-practice threshold identified in FranFunnel’s franchise development research.
- Show rate: above 75% for scheduled discovery calls.
- Post-handoff completion: above 70% between each major funnel stage.
- Lead-to-agreement conversion: FranConnect’s 2025 benchmarking data puts this at 1.50% across the brands it tracked, with high-engagement brands showing roughly 1.9 times the net unit growth of low-engagement ones.
The 2026 Annual Franchise Development Report found recruitment spending has stayed largely flat, lead-to-sale rates hover around 2% but vary sharply by vertical, and only about half of franchisors track cost per lead at all. That last figure matters: if your peers aren’t measuring cost per lead, comparing your raw numbers against generic “industry average” claims is close to meaningless. Compare against your own vertical, not the market as a whole.
How do you build a recruitment KPI dashboard?
A working dashboard needs five fields, checked at different frequencies depending on how quickly each metric can drift.
- Response-time widget: real-time or daily, showing median and 90th percentile speed-to-first-contact.
- Rolling contact rate: updated daily, trailing 7 and 30 days.
- Show-rate trend: weekly, segmented by recruiter and by lead source.
- Funnel conversion by source: weekly, from lead through to signing.
- Cost per sale by channel: monthly, including broker fees and overhead, not just media spend, as franchise KPI guidance recommends when calculating true acquisition cost.
Assign ownership before you assign targets. Whoever answers the phone owns contact rate and response speed. The recruiter running discovery calls owns show rate. The franchisor or development lead owns cost per sale and overall conversion, with an agreed escalation point if any metric slips two weeks running.
Pro Tip: Sync your CRM timestamps with your calendar and SMS logs before you trust a single dashboard number. A meeting booked in one system and confirmed in another almost always produces a show rate that’s quietly wrong in one direction or the other.
How do you fix weak recruitment KPIs quickly?
Diagnosing a weak number is faster than most franchisors expect, provided you look at the right log before changing anything.
- Low contact rate: pull your response-speed logs first. Slow response usually explains a weak contact rate more than lead quality does. Check staffing coverage against when leads actually arrive, particularly evenings and weekends.
- Poor show rate: add a same-day reminder and an agenda-setting message the morning of the call, plus a one-tap reschedule link instead of a phone tag loop.
- High post-handoff drop-off: install stage-triggered automations that fire the moment a candidate moves stage, and require a confirmed next-step booking before the handoff counts as complete.
- Rising cost per sale: review conversion at the source level before cutting budget anywhere. AFDR reporting shows referral programmes convert at notably higher rates than paid channels despite taking a small share of spend, so pause underperforming paid sources before touching referrals.
- Run small experiments: A/B test reminder timing (24 hours versus 2 hours before a call) and test SMS-first outreach against email-first for initial contact.
Why does recruitment rhythm matter more than raw activity?
Recruitment rhythm describes a disciplined, forecastable recruitment cycle rather than reactive bursts of activity chasing whichever lead source is loudest this month. The goal is forecast variance within 5 to 10% month to month, which lets a franchisor plan staffing and budget with confidence instead of guessing.
Predictability in recruitment isn’t a nicety bolted onto a good process. It’s what separates a franchisor who can plan next quarter’s staffing and budget from one who’s permanently reacting to whichever week produced a burst of leads.
Three steps build that rhythm. Standardise the very first candidate call so every recruiter asks the same qualifying questions in the same order. Track kept-call to signing ratios by recruiter, not just team-wide, since individual performance gaps hide inside averages. Run a short weekly forecast calibration comparing predicted signings against actuals, and adjust staffing before the gap becomes a quarter-long problem.
How do you measure lead and recruit quality, not just volume?
A high contact rate with poor-fit candidates still produces a weak pipeline. Quality metrics catch what volume and speed metrics miss.
Qualification scoring rates each lead against defined criteria before it enters your active pipeline: liquid capital, relevant experience, location fit, and stated timeline to invest. Score consistently and you can compare lead quality by source, which usually reveals that your cheapest channel also produces your worst-fit candidates.
Fit assessment goes further than financial qualification. It looks at whether a candidate’s working style, risk tolerance, and management approach actually suit the brand’s operating model. A candidate who passes every financial checkpoint but expects a passive investment will struggle running a hands-on service franchise, and that mismatch rarely shows up until months after signing.
Track a quality-adjusted conversion rate alongside your raw conversion rate. If 100 leads convert at 3% but only 40 of those leads were genuinely qualified, your real conversion rate against qualified pipeline is closer to 7.5%. That distinction changes how you judge a channel’s performance, and it stops you pulling budget from a source that’s actually performing well once you strip out the noise.
Segment every quality metric by source. Referral and personal-network leads typically arrive better qualified than cold paid traffic, which is part of why referral programmes convert at higher rates despite smaller budgets.
Do recruitment KPIs predict long-term franchisee success?
The connection between early recruitment metrics and long-term franchisee performance is stronger than most development teams assume. A candidate who moved through a rushed, poorly qualified pipeline is statistically more likely to struggle once they’re operating a unit, simply because the mismatch that a proper fit assessment would have caught never got surfaced.
FranConnect’s benchmarking data found that brands with higher candidate engagement throughout the recruitment process saw materially stronger net unit growth than brands with weaker engagement. That gap doesn’t stop at signing. Engaged, well-qualified franchisees tend to open faster, ramp revenue sooner, and stay in the system longer, because they entered with realistic expectations set during a properly run recruitment process rather than a rushed close.
Post-handoff completion rate is the clearest leading indicator here. A candidate who skips steps or needs constant chasing during recruitment often repeats that pattern during training and early operations. Franchisors who tie recruitment KPIs to onboarding data, not just signing data, tend to spot at-risk franchisees months before a struggling unit shows up in financial reporting.
Treat your recruitment funnel as the first chapter of franchisee retention, not a separate process that ends once the agreement is signed. The discipline that produces a strong contact rate and a clean show rate is the same discipline that produces franchisees who ramp up successfully and stay in the network.
Start measuring recruitment KPIs from day one
The franchisors who see the fastest improvement don’t overhaul everything at once. They instrument first, then set targets, then test.
Step one, get your CRM capturing clean timestamps: lead creation, first contact, meeting booked, stage change. Step two, set targets against the benchmarks above, adjusted for your vertical and investment level. Step three, run one 30-day experiment, starting with text-first outreach within 60 to 300 seconds of lead creation, and measure the shift in contact rate and show rate before touching anything else.
Franchiselocal supports that first step directly. The planning toolkit and calculators help franchisors model cost per lead and cost per sale before committing budget to a new channel, and the franchise directory gives franchisors and brokers a listing platform built for exactly the kind of qualified, engaged enquiry that feeds a healthy recruitment funnel. If you’re weighing which sector to prioritise for recruitment investment, browsing live categories such as business services franchises or checking trending franchise opportunities is a practical way to see where candidate demand is strongest right now. Start with the timestamps, set your first targets this week, and list your opportunity where qualified candidates are already searching.